-
Mnova NMR
New Features
New Options for the Data Analysis tool. The Data Analysis feature has been highly enhanced.
- It is now possible to exclude points from the left and right edges of the graph…

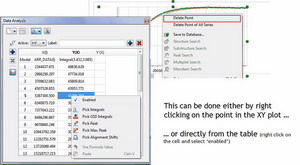
- … or to disable points either directly from the XY graph or from the table:
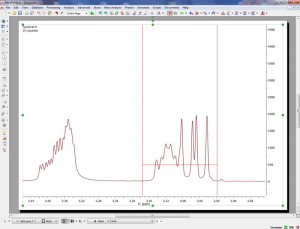
- The user can change the shape of the selection feature in order to take into account the peaks movements (which is a complement to the new automatic alignment algorithm for arrayed datasets (very useful for kinetics or reaction monitoring experiments by NMR).
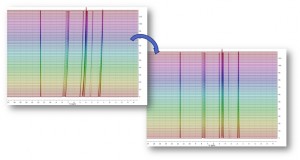
- Here you can see the effect of the application of the new alignment algorithm
Enhancements in the stack feature
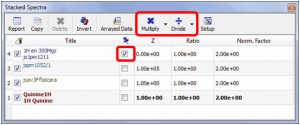
- New way to normalize the traces of a stacked plot. Just check the box of the trace that you want to modify and click on the ‘Multiply’ or Divide’ buttons of the dialog box
- Ability to hide any number of spectra in an arrayed item. To hide any of the traces, just uncheck the left check boxes of the ‘Setup Arrayed Table’:
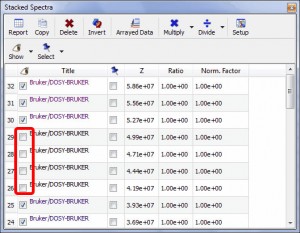
From this table, you can also easily sort the traces just by clicking on the number of the spectrum for which you want to change the location and dragging to the desired location
- Capability to show decimated stacked plots. This option is very useful when the number of stacked spectra is very large, slowing down the plotting and not showing relevant information.
Here you can see an example; showing the result of a R-M experiment consisting of 700 spectra, and how the dataset will look like after decimation:
- Multiple spectral selection is allowed.
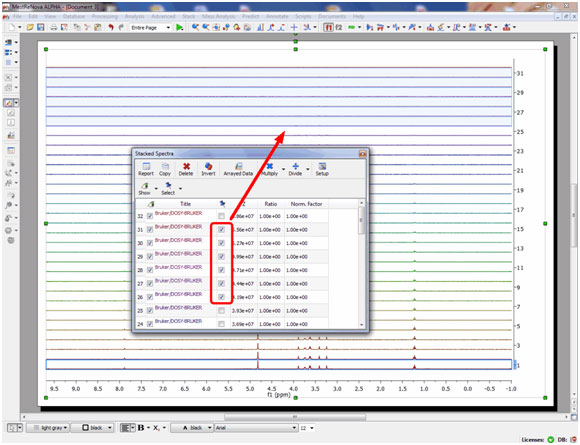
Mnova includes a powerful and easy to use multiple spectral selection mode, which allows the user to optimize the processing of groups of spectra by selecting a bunch of spectra and applying any processing. Multiple spectra selection can be done either graphically from the stack or directly from a table.
Enhancements in the Multiplet Analysis feature.
- Capability to sort the multiplets in ascending order from the GUI and new journal templates
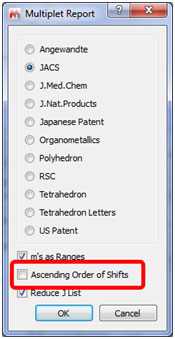
It is now possible to sort the multiplets in acending order just by checking the applicable box of the Multiplet Report dialog box. As you can see there are many new journal templates by default:
- Manual multiplet analysis with peaks threshold
This new feature will allow you to select the peak threshold for your multiplet analysis
- Capability to show all degenerated coupling constants in the multiplet report
It is possible to show all degenerated coupling constants by just unchecking the option ‘Reduce J List’ to show all the J values.

- Capability to report some multiplets as ranges and other as shifts.
If the class of the multiplet is called ‘mx’ (being x any letter); the multiplet will be reported as a chemical shift instead of the multiplet range. Here you can see the difference:

- Capability to report Multiplets from the Multiplet Manager dialog box
A new button to report multiplets has been added in the Multiplet Manager dialog box
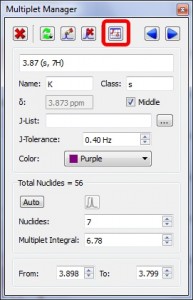
- Capability to report only compound peaks
It is now possible to generate only compound peak reports (without impurities or solvents peaks)

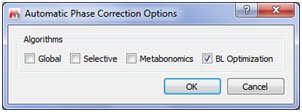
New automatic Phase Correction algorithm with Baseline optimization
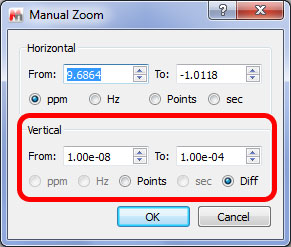
Manual zoom in Diffussion scale
- It is now possible to manual zoom in the diffusion scale:
Ability to modify the intensity of the traces without needing the scroll wheel.
- You will not never need a mouse with scroll wheel to increase the intensity of your “D traces, just use the shortcut ‘Ctrl+Shift+Up/Down’ for the horizontal trace and ‘Ctrl+Shift+Left/Right’ for the vertical one.
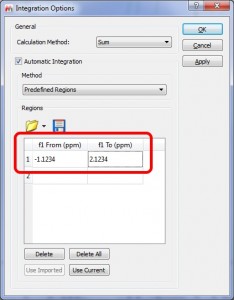
Ability to set values with 4 decimals in the Predefined Regions Integration
- It is possible to select predefined integral regions with 4 decimals (in the previous versions you could only use 3 decimals).
Ability to automatically import any number of spectra and automatically stack them
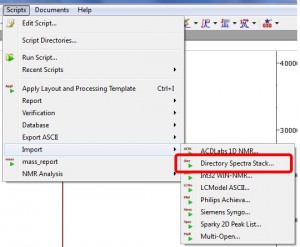
- We have written a new script to automatically import a collection of 1D datasets and stack them automatically
2D ploting method can be selected by default
- 2D ploting method is now a spectral property so the user and can selected the default method (bitmap, contour, stacked or white washed).
New scripts to export the fit peaks to a text file or all the Peaks Table contents into a .csv file for all the 2D spectra of the current document Resolution factor to display GSD peaks
- The user can now select the resolution factor to display GSD peaks from the NMR preferences menu
Export to ASCII a selected area of the spectrum
Bugs Fixed
- Problem with phase correction when opening some 250MHz spectra from Bruker
- Problems pasting annotations of NMR Peaks
- Problems integrating an array dataset with the Data Analysis panel open
- Manual integrals were duplicated after automatic integration
- Overlapped integrals were got after an automatic integration with the peak picking algorithm
- Rectangular background on stacked spectra with angle different from zero
- Wrong FT was automatically applied to some 2D from Varian
- Cuts at the edges were restored after a binning
- Problems opening DEPT dataset in arrayed mode from Varian
- Some spectra became invisible after applying multipoint baseline correction when two or more consecutive points have the same x value
- Problems opening an array experiment with Jcamp.dx format
- Error running assignmentTest example script
- Time stamp of spectra was not shown in the X(I) axis of Data Analysis graph
- F1 was taken as 13C instead of 1H in TOCSY spectra
- Be able to save traces in a 2D layout template
- Problems with Analysis features in the processing templates
- Problems deleting rows from the Data Analysis panel
- Some Anasazi datasets were opened reverted
- Problems superimposing binned and not binned spectra
- Problems with navigation buttons in a spectrum with cuts
- Problems keeping the edited multiplets unchanged after automatic multiplet analysis
-
New Features
Capability to create User Databases to train the neural network algorithm, improving the prediction results of similar structures.
- This feature will allow the user to build databases with experimental assigned spectra which can be used to enhance the prediction results of similar structures. More info on this tutorial.
- NMR Predictions are now faster, more stable and accurate
- Ability to access the 1H and 13C prediction tables by a script
Bugs fixed
- Problems modifying a chemical shift in the 1H-Prediction table after having sorted them
-
New features
Mnova MS released for Mac and Linux
- Mnova MS is now available for Windows, Mac and Linux. Visit this page and find out which data formats are available for each OS.
Capability to change the integral regions
- It is now possible to change the integrals regions of your TIC as you do with your NMR dataset (just by dragging&dropping the little green boxes). You can also freely move the wedges of the integrals (vertically or horizontally) by pressing the SHIFT key.

Enhancements with the Traces
- It is now possible to extract the “Total UV” and “Maximum Absorbance” (a plot of the maximum absorbance from each PDA spectrum vs. retention time) chromatograms.
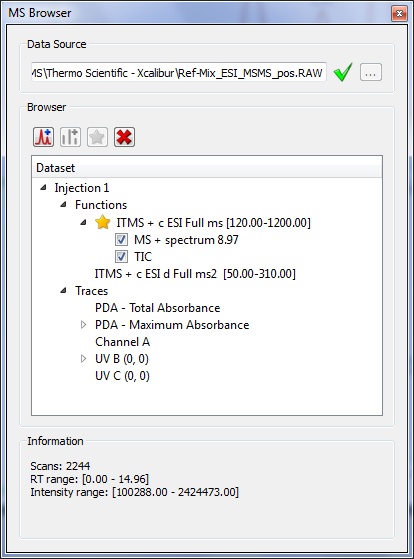
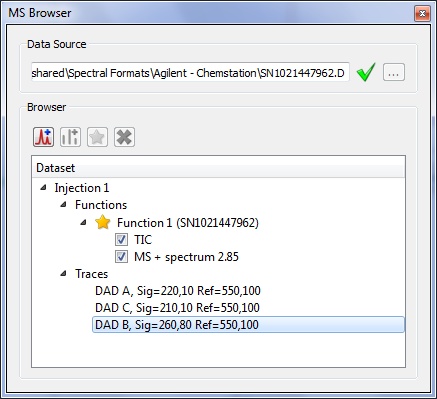
- We have added UV wavelength to Agilent UV chromatogram descriptions.
 Auto intensity scale mode for MS datasets
- The intensity of the MS datasets will be auto-scaled when they appear on the spectral window.
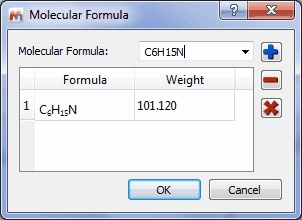
Capability to run Molecule Match using molecular formula
- It is possible to run the ‘Molecular Match’ feature just by entering a molecular formula:
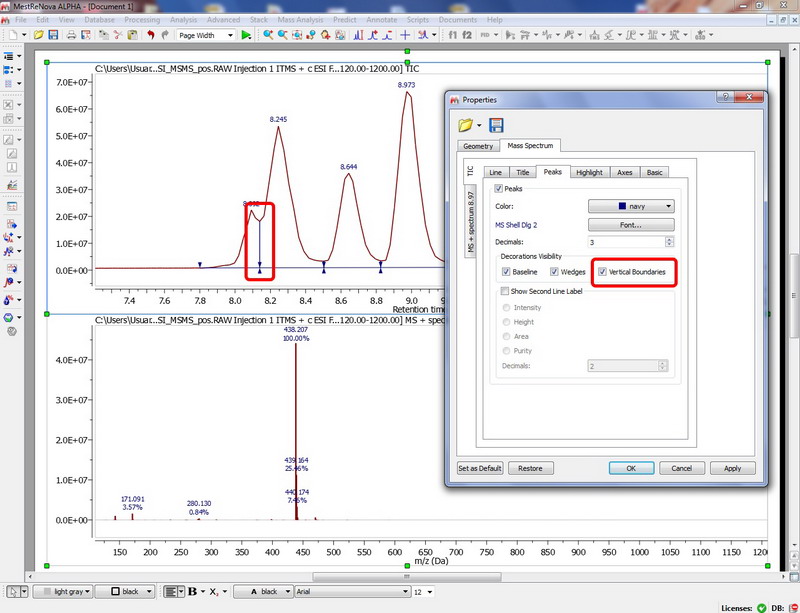
Option to show vertical boundary for peak areas
Peak integration is made easier

Bugs Fixed
- Fitness threshold was ignored when showing results in elemental composition
- Error in fitness calculation of Elemental Composition
- Problems with the intensity of UV traces from Agilent datasets
-
New Features
GUI chinese version relesead.
- We have added a chinese version to our GUI which is now available in English, Spanish, Russian, Japanese and Chinese.

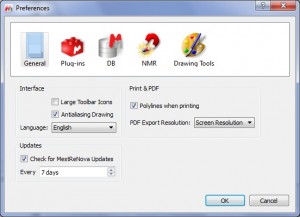
Capability to print the spectra with polylines
- This feature will enhance the quality of the exported PDF minimizing the file size
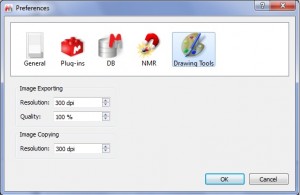
Capability to select the resolution of the images to be copied
- Export datasets as images with high resolution by using this new feature
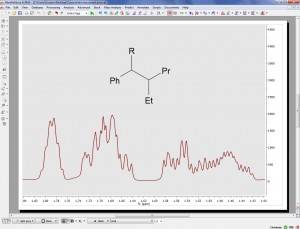
Import generic atom labels such as Ph, R, by pasting molecular structures as MDL SK
- It is now possible to import molecular structures with generic atom labels
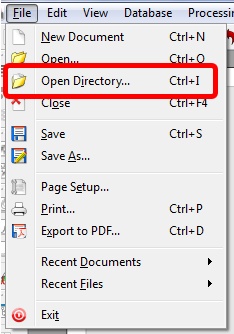
Capability to open a folder which contains a dataset
- It is now possible to open a folder from the GUI which contains a dataset as you can do by dragging&dropping.
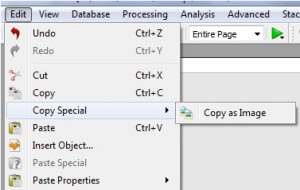
Capability to copy to the clipboard the datasets just as images3
- You can copy to the clipboard your datasets as images by using this new feature.
- New page button available to be included in a toolbar
- Remember the directory used to get the last data in order to save the document
- Deleting a page in a document backs to the previous slide
- Import Mol file together with the spectrum
Bugs Fixed
- Dashes and dotted lines for polygons made the lines not visible
- Low resolution when printing spectra inserted as metafiles in a document
What’s new in Mnova 6.2.0
0
Share.

