-
New Features
New powerful and more accurate algorithms for Peak Picking, Integration and Multiplet Analysis A new refactoring for the Peak Picking, Integration and Multiplet algorithms has been implemented in Mnova 7 with the objective to get more accurate, detailed analysis and to minimize the need for user interaction. Peak Picking
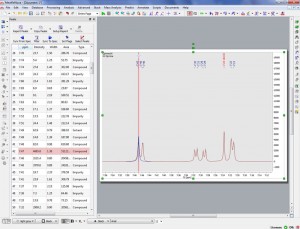
- This is a major change to Mnova NMR functionality. The default automatic Peak Picking algorithm is now based on GSD, rendering enhanced resolution, identification of overlapped peaks and also including autodetection of solvent and impurities.
 Example of the enhanced resolution achieved by the new Peak picking algorithm, now capable of identifying shoulders on large peaks as smaller peaks and of labelling and include them in multiplet analysis.
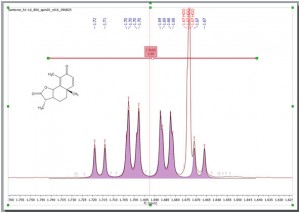
- Peak curves are now active objects which can be interacted with, and three-way highlighting of peaks table, peak labels and the peak themselves has been implemented. For example, hovering the mouse over the peak label (or on any table) will highlight the peak in the spectrum and allow the user to interact directly with that peak or; automatically scroll up/down the table to the position of currently highlighted peak in the spectrum just by clicking on it
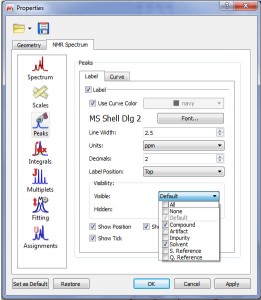
- The user now enjoys the capability of selecting which kinds of peaks are to be shown/hidden (Compound, Solvent, artifacts, etc).
- Peak labels are also hot areas which can be selected and interacted with just by right clicking on it (NMR peak context menu).
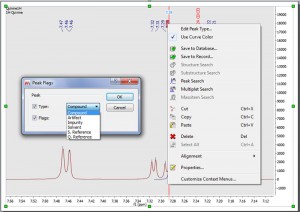 From here you can edit the Peak Type, use the curve color for the peak label, run a Peak Search in the DB, etc
- A series of graphical display enhancements relating to peaks are now implemented in Mnova, including:
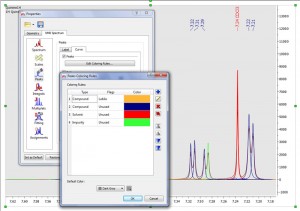
Capability to change the color peak curves (depending on the type and flags)
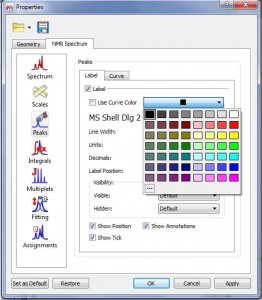
Capability to change the color peak labels (or use the same curve colors)
- NMR Peaks & Snap also pastes annotations
Integration The integration algorithm in Mnova also benefits from the exploitation of GSD capabilities, with GSD generated integral values becoming the new default in Mnova.
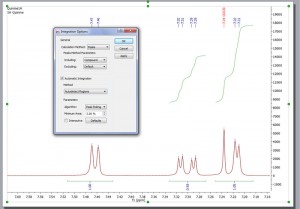
- This will give the user the ability to select what kind of peaks will be taken into account for the integration. In the example below we have excluded the solvent signal for the integration.
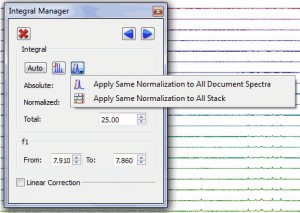
- Capability to compare integral values of different spectra.
It will be possible to apply the same integral normalization to all the spectra (in the current document) or to all the traces of a stack plot by selecting the applicable option, as you can see below. This is very useful if you need for example to determine relaxation times from a series of 1D spectra, to be able to compare the integral values between the different traces.
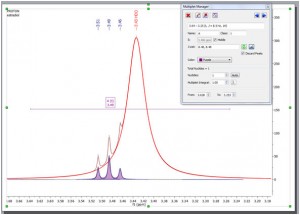
Multiplet AnalysisOnce again, Multiplet Analysis benefit directly from the exploitation of GSD capabilities to carry out the automatic analysis, with the enhanced peak picking capabilities resulting in much more reliable automatic multiplicity identification and labeling.
- Here you can see an example of a triplet which is hidden under the solvent signal:
- New Multiplet Analysis Options (independent of peaks and integrals settings).
You will be allowed to select the minimum area and what kind of peaks (Compound, Solvent, artifacts, etc) will be taken into account for the multiplet analysis.
- Capability to show number of multiplets as a floating point number in the multiplet label.
- Copy the multiplet report from the table by using Ctrl+C.
Improvements in the Assignment feature The assignment features in Mnova have been greatly enhanced with the objective to very significantly improve the workflow of the chemist when assigning multiple spectra sets.
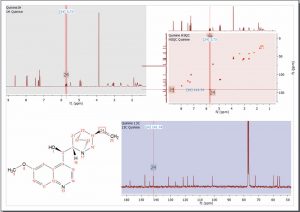
- New graphical assignment labels for 1D and 2D, which can be permanent as well as activated on hovering, to allow the user to more easily keep track, with a quick inspection, of peaks which have and have not been assigned.
Assignments are displayed directly on the chemical shift position
- After assigning a 2D peak, the correlated assignments are added to the applicable 1D peaks
Improvements in the Data Analysis module
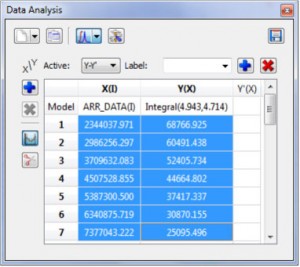
- Capability to update Data Analysis graphs after having changed the order of the stacked spectra.
Right clicking on the Data Analysis Graphic, will allow you to update the graph after having made changes in the Stacked Spectra Table or directly on the stacked spectra (very useful, for example if you invert the order of the spectra):
- Capability to ‘Set Area Normalization and Dilution Compensation Parameters’ (by right clicking on any point of the Data Analysis Graph) for example for Reaction Monitoring analysis, to account for situations where, for example, further dilution has been carried out half way through the reaction.
- Copy xy values from Data Analysis by Ctrl+C
Improvements in the scripting engine
- New scripting capabilities.
(Line Fitting, Multipoint Baseline Correction, set 1D spectra as external traces of a 2D, change the color of the atom, cut without reprocessing the spectra, Help button in the scripts editor, Number of Nuclides computation, interrupt a script, Improvements Report Assignments, Access to more graphical objects)
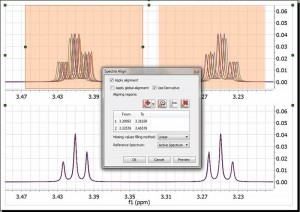
Enhancements in the spectral alignmentWe have improved the traditional cross-correlation algorithm by working on the first derivative domain calculated using an improved Savtizky-Golay routine in which the order of the smoothing polynomial is automatically calculated. The idea is to minimize potential problems caused by baseline distortions or very broad peaks. We have found this method to be very useful not only in the context of metabonomics, but also in the alignment of Reaction Monitoring data sets.
Generalized Indirect Covariance NMR (GIC)
New method to apply indirect CoNMR for the reconstruction of non-symmetric spectra from pair s of 2D spectra that have a frequency dimension in common (i.e. COSY and HSQC). Other features
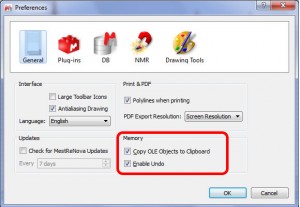
- Capability to avoid memory issues, when you work with huge datasets (allowing the user to not copy the OLE objects to clipboard or to disable the Undo feature).
- New versions of sinebell apodization from Varian has been implemented
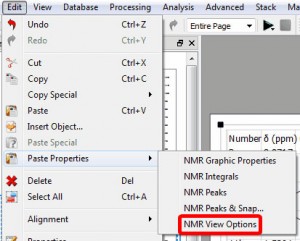
- Capability to copy ‘view options’
This option will be used to copy the zoom and cuttings from one spectrum to another (or others).
- It is not needed to highlight the spectrum to enable the processing commands if the current page contains only one spectrum
- Tables and panels now refresh by selecting the spectrum in the Page Navigator
- Thumbnail pages have been improved
- Imported Phase Correction can be used in the Processing Template
- Option to auto delete 1D spectra after stacking them
- Title of active superimposed spectrum with the same color as the spectrum
- Tooltip to show how to scale or move in traces in a 2D dataset
Bugs Fixed
- Middle value in multiplet manager did not get restored
- The units on the Diffusion axis did not expand properly after zooming the 2D-DOSY
- Problems generating multiplet reports from.mrc files
- Problems in line width calculation of peaks in spin simulation
- Show a warning message when running Report Assignment and no mol is selected
- Problems fitting manually added peaks with Line Fitting function
- Wrong peak label position in negative peaks
- Problems deleting the class of a multiplet in the multiplet manager
- Problems with nitrogen atoms imported as MDL MOL files from Chemdoodle
- Problem opening Bruker getfile files
- Linewidth values smaller that 0.5 did not work as expected
- Wrong automatic processing of 31P spectra
- Wrong values in the data obtained from binning
- Problems moving peak labels and integrals according to modification of reference via script
- Keep the assignments of a molecule extracted from the DBA
- Problems clicking Recalculate button in Spin Simulation with an experimental spectrum selected
- Imported multirow nmr files from Philips showed wrong values in time scale
- Problems fitting to a exponential function in Data Analysis with some datasets
- Problems making too narrow a stacked spectra
- Same number of decimals in the multiplet box and peak labels
- Problems zooming in a stack of 2D spectra
- Green highlighted regions for Data Analysis disappear after copy and paste
- Wrong Number of Nuclides calculations are fixed
- Problems copying big datasets to the clipboard
- Problems running several Bayesian DOSY Transformations in the same document
- DOSY peak labels were not given in Diffusion units
- Active spectrum was not updated after double-clicking in Stacked Spectra table
- Problems reading SW and LW parameters of a Bruker dataset
- Selection of active spectrum from Stacked Spectra Table did not work in superimposed mode
- Problems opening a set of stacked spectra from VNMRJ
- Hidden annotations appeared exporting to jpeg format
- Capability to delete assignments from the Assignment table
-
New Features
- New Powerful and more accurate algorithms
- Capability to predict different conformers and to show them in a 3D molecular viewer.
- Capability to run predictions in D2O
- Capabiltity to change the prediction values from the molecular structure
- Capability to show the prediction values as atom label.
- Capability to recognise diastereotopic CH2 adjacent to a chiral centre
Bugs Fixed
- Problems running 1H-NMR predictions of molecules with transition metals
- Send to DBA actions were not activated if the assigned molecule was in the table
- Error message when canceling the DBA update
- Problems removing molecules from 13C DBA from the GUI
- Problems with compounds in salt form
-
New Features
- Capability to select the UV trace from a given wavelenght range.
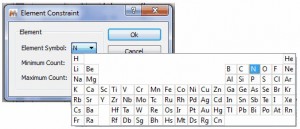
- Periodic table for the atom constraint in the Elemental composition tool
Bugs Fixed
- Problem opening big MassLynx MS datasets
- Mol Match could not be performed unless the mass spectrum was selected
- Problems getting back to full spectrum after zooming in too much
-
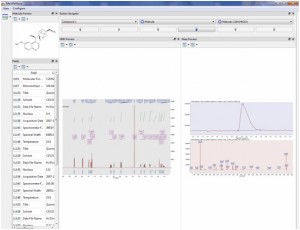
We have added a new plugin to the Mnova environment, for the storage, indexing, management and searching of NMR and LC/GC/MS data, as well as of molecular structures and all related information. Some of the main features and capabilities of this Spectral DB are:
- Fully integrated within the Mnova GUI, you can save or drive searches directly from within your Mnova GUI, by using the new menus, new toolbars or by right clicking on any object.
- Search 1D and 2D peaks, multiplets, isotopic clusters or MSMS peaks, or a combination of all those, to quickly find information about any similar data your organization has run in the past.
Please note that this plugin has a server-client architecture, so you will need to install the server and you will need to add a license to the client to be able to use the functionality.Find out more about Mnova DB.
-
New Features
3D Molecular viewer
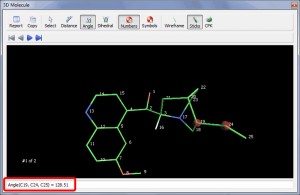
- A new 3D molecular viewer has been implemented, allowing the user to measure bond distances, angles or dihedrals.
Capability to import .cdx file from ChemDraw
What’s new in Mnova 7.0.0
0
Share.

