
Residual Dipolar Coupling experiments can be analyzed, and alignment tensors determined also with Mspin. Once the molecular structure has been loaded, the user will need to load an input file containing the experimentally measured RDCs by clicking on "Load Experimental Data" button (red rectangle in the picture below) or by using "Paste Data" button if the corresponding file has been opened.

Once the data are loaded, the user will be able to select the computation algorithm (SVD, TRAMITE or Almond-Axelmeyer) by using the '˜Computation' scroll down menu.
- SVD (Singular Value Decomposition): It provides the best minimum squares solution according to the experimental data. It is the most used method.
- Tramite: it assumes that the vectors system of the alignment tensor has the same orientation as the inertia vector.
- Almond: it assumes that the spin tensor has the same direction that the inertia vector.
In this case we have selected the SVD method and then clicked on the "Calculate" button (green rectangle in the picture below) to perform the computation. We have also ticked on the "RDC" box to display the values on the molecular visor, as you can see in the picture below.
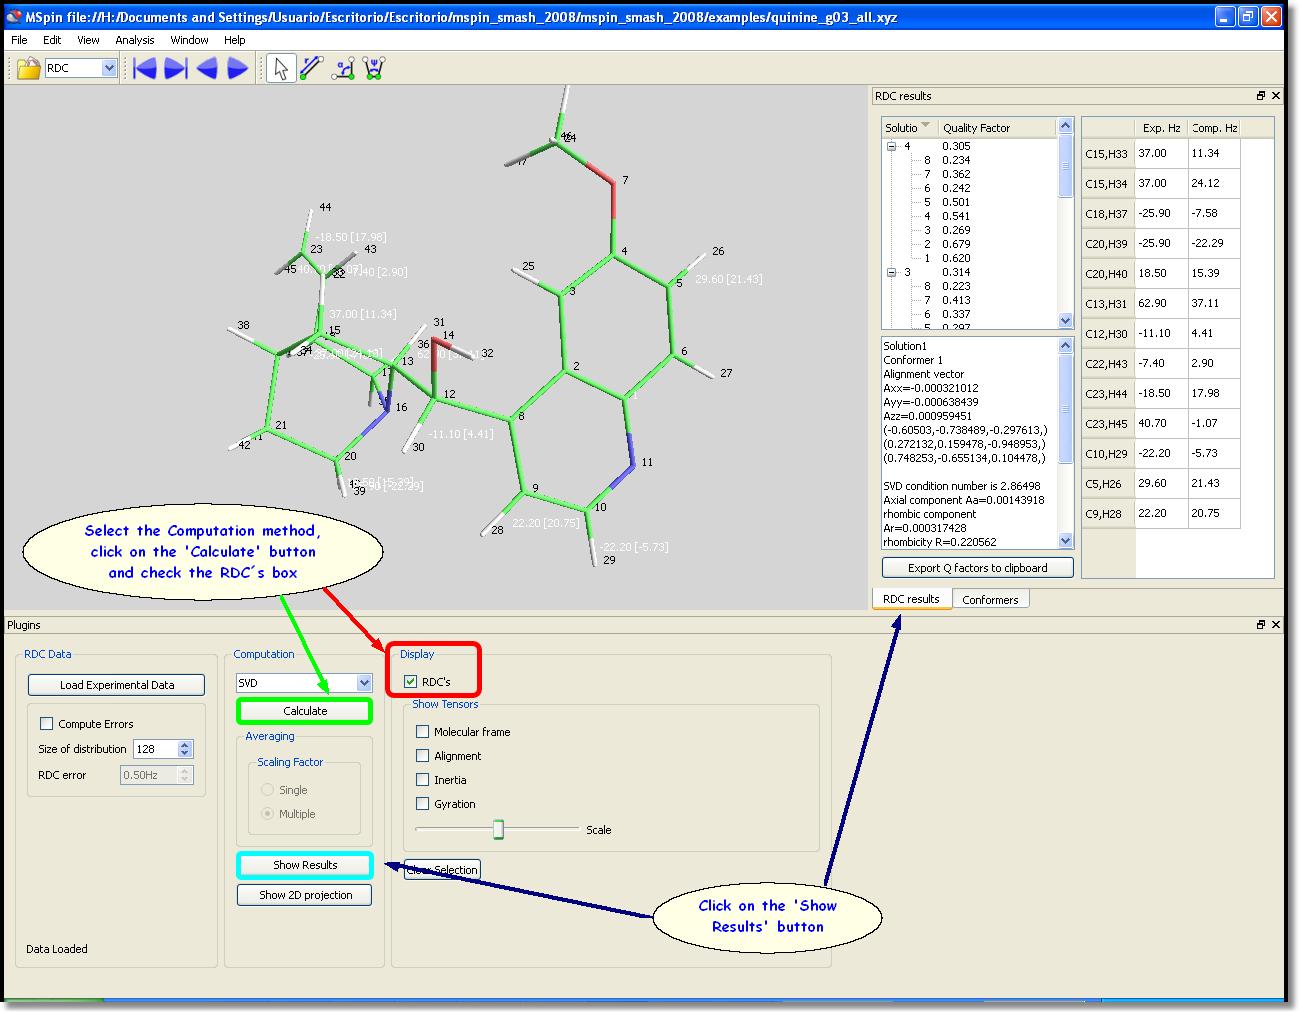
The user will obtain a table with the outcome by clicking on '˜Show Results' button (blue rectangle in the picture above). The RDC result window shows the conformers list, with the corresponding quality factor 'Q' for the current structure (the lower the better) as well as the most important computed parameters. On the right side of this window, the user will find a list of the experimental and computed RDCs. Clicking on a cell will highlight the corresponding coupled pair as transparent yellow spheres on the molecular visor. The solution 4 (Q=0.234) of the conformer 8 is shown in the picture below:

The user will be able to show the molecular frame axes just by ticking the desired option on the '˜Show Tensors' menu (red rectangle on the picture below). In the same way, the Tensors (Alignment, Inertia or Gyration) will be displayed (and scaled) on the molecular visor by selecting the desired option on the '˜Show Tensors' menu.

Multistructure files are supported in RDC computations. For them, the user can select the alignment as "Single" (in the 'Scaling Factor' option), to obtain a single alignment factor fitted for all the molecules in the file (recommended for molecular dynamics). In the other hand, the user can select the "Multiple" option, and each molecule factor will be fitted individually (convenient for conformational sampling). The RDC plugin also allows the automatic permutation of pairs. To do that, the user must specify the atom pairs to be swapped:
rdc_data 14 15 -2.0 14 16 8.0 } permutations { 15 16 }
This input file will compute automatically two solutions, one for the pair D14,15 = -2.0, D14,16 = 8.0 and other for the pair D14,15 = 8.0, D14,16 = -2.0. Error analysis of RDC experiments is possible by using the SVD method. Once your data have been loaded, check the 'Compute errors' box. This will generate a gaussian distribution centered around each measured value, and with a standard deviation given in the RDC error check boxes. Click on the 'Show 2D Projection' button to show how the values are scattered around the map in a Sasom-Flamsteed map projection:

