
Fundamentally, how does it work?
When the area of a multiplet is determined, this is related to its concentration, in a simple way:
(1) C ∝ AI/NN
Where C is the concentration of a chemical species, AI is the absolute integral for a multiplet attributable to that species, and NN is the number of nuclides (Hs, usually) for that multiplet.
From this we derive:
(2) C = CCF * AI/NN
This says that a proportionality constant – which we call the Concentration Conversion Factor (CCF) – allows us to convert a measured AI/NN into a concentration. Fundamentally, the CCF only needs to be determined once for an experiment, and then it is applicable to all chemical species in the reaction!
Determining the CCF
It therefore follows that a sensible way to proceed with quantified, reaction kinetics data extraction hinges on the determination of the CCF for that particular experiment. Once that has been performed, then all other species concentrations can be determined by applying equation (2), where the AI is determined by the software, and NN is provided by the user.
How this works, practically
The first time the user specifies an integral region, he is provided with a number of ways to help the software determine the CCF. Note that this number is not necessarily shown, but for all subsequent integral region definitions Equation (2) is applied using the newly-derived CCF.
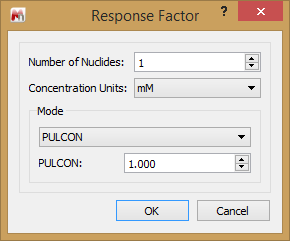
We see the options in the screenshot, below.

Option 1: Initial concentration
If the concentration of a species is known at a time point, then this is a convenient way to assist the software in determining the CCF.

Choose this option and you will need to accurately provide the details requested:
- NN for the integral region
- Concentration units
- Spectrum index
- Known concentration
The spectrum index may be obvious (1 for the first spectrum), or can be determined by clicking on the spectrum row of interest and seeing which row in the Data Analysis panel is highlighted. This allows the user, for example, to select a dataset at the end of the reaction, where a single product completely formed may also represent the “initial concentration”. Of course, this is really a final concentration.
You may want to select a region in the first spectrum that has intensity from both reaction and (partially formed) reactant. The sum of these may be known if the reactant was weighed, and solvent volume is known. This “concentration” can be hidden from the curves.
PULCON
Named after the approach used by Bruker, this option is more accurately called CCF. Here you can enter the CCF for your experiment. How this is determined is explained in some of the articles prepared for the qNMR functionality.
For example, see here: qNMR-CCF-practical.pdf
For more general reading: Resources for qNMR.
Internal reference
There are occasions when each spectrum can contain a signal whose area represents a given concentration. This could be inserted electronically (e.g., ERETIC, or QUANTAS), residual protonated solvent signal, or perhaps the chemical shift reference.
If this is available then it can be specified in this way.

It is important to note that this method differs from all other CCF determinations in that a new CCF is determined for each spectrum, rather than using a single value across the total data array.
Formula
If you really want to get down to the lowest working level, then this is the way for you! If I need to explain this then it may be too complicated for you!

Conclusions
Mnova RM plugin is very well poised to help you work with kinetic data and generate plots of Conc. v time. We describe here the ways the concentration can be determined.


