Analysis for the determination of a biologic drug’s higher order structure
Mnova BioHOS is designed for the NMR analysis of biotherapeutics, like monoclonal antibodies. 2D NMR spectra of reference samples are compared with that of each test sample using a fingerprinting, or spectral similarity determination.
Licenses of Mnova NMR and Chemometrics are required to use Mnova BioHOS


Designed in collaboration with Bruker BioSpin, Mnova BioHOS capabilities will support your analytical needs for the Quality Assessment of Biologic drugs using 2D NMR spectral data.
What’s new since Mnova BioHOS 3.0?
The new version of this BioHOS plugin has been released with Mnova 14.3 and brings a number improvements on chemometrics:
- Introduced with Mnova 14.3.1 the implementation of Partial Least Squares (PLS) regression, facilitating analysis and prediction of dependent variables from independent variables (such as binned spectra) while offering graphical evaluation tools.
- Implemented a soft independent modelling by class analogy (SIMCA) Model Classification, which is a statistical method for supervised classification of data
- Enhanced the PCA analysis tool with new features, such as:
- Displaying Quantile Plots (1D NMR)
- Quantile Plot comparison tool
- Displaying plot labels
- Improved selection and interactivity in the Scores and Loading plots
- More options to calculate distances in the Scores plot
- With the PROFILE analysis tool, you can now export fingerprint spectra and synchronize plot crosshairs
- You can also now auto detect reference peaks in CCSD
- For data preparation we have implemented Probabilistic Quotient Normalization (PQN) and we are now able to provide an optional visualization of normalization results.
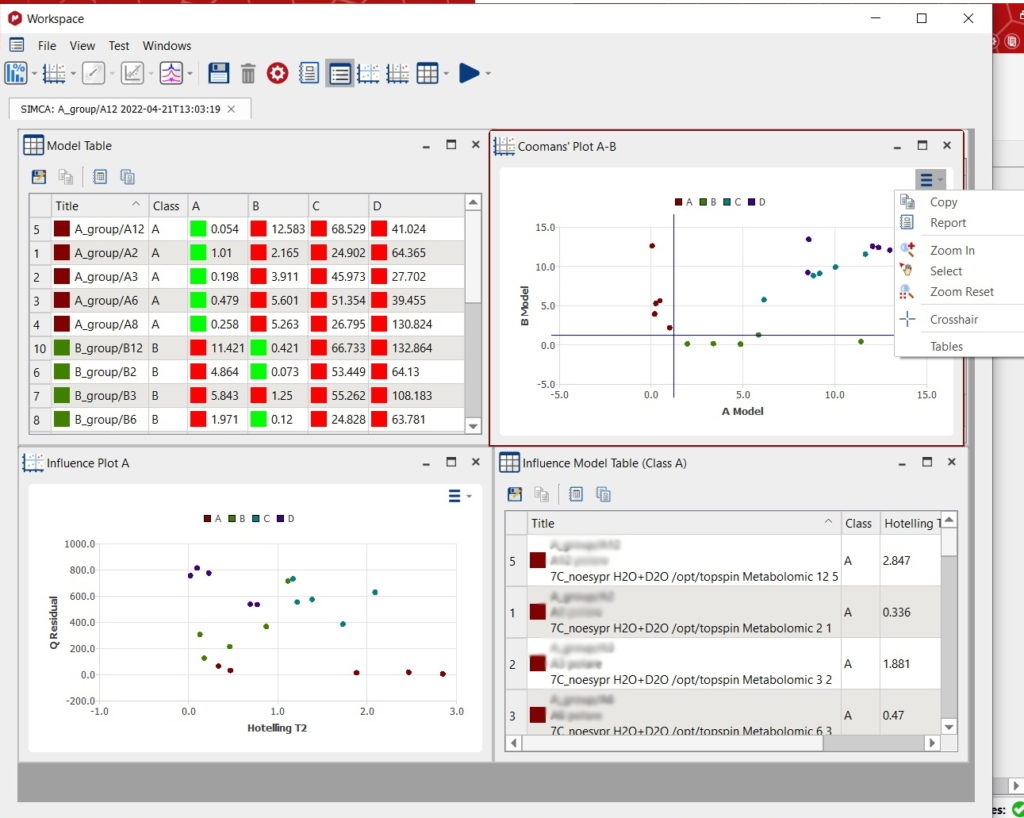
The new SIMCA Model Classification panel shows the resulting model table
Mnova BioHOS: 45-day free trial version
 1. Download
Download Mnova for a suitable Operating System
 2. Installation
Open Mnova and go to ‘Help/Get-Install Licenses’. Select ‘Evaluate’.
 3. License
Fill in the form to receive your trial license via e-mail.
Help & Resources
 Videos
Mnova BioHOS
Highlights
Mnova BioHOS – NIST mAb data
Reference: Robert G. Brinson at al. (2019) Enabling adoption of 2D-NMR for the higher order structure assessment of monoclonal antibody therapeutics, mAbs, 11:1, 94-105
DOI: 10.1080/19420862.2018.1544454
Data relating to the NISTaMb Interlaboratory study and useful reference material can be found here
Mnova BioHOS
Features
- Pairwise intensity comparisons of points with the same coordinates in the reference – and test spectra
- A regression line is computed for the scatter plot of points. Manual and automatic noise cancellation
- Adjust threshold for residuals
- Selected peaks in the reference spectrum are matched with peaks in the test data and the Combined Chemical Shift Difference (average and per peak pair) is calculated
- Average CCSD for each test spectrum, to rank them by similarity with the reference
- Plot CCSD values and amplitude ratio per pair of peaks and inspect relevant spectral regions with just one click
- Dedicated features for data management including: adjusting preparation parameters, binning to reduce data size, conducting integrity checks, filtering, normalizing and scaling
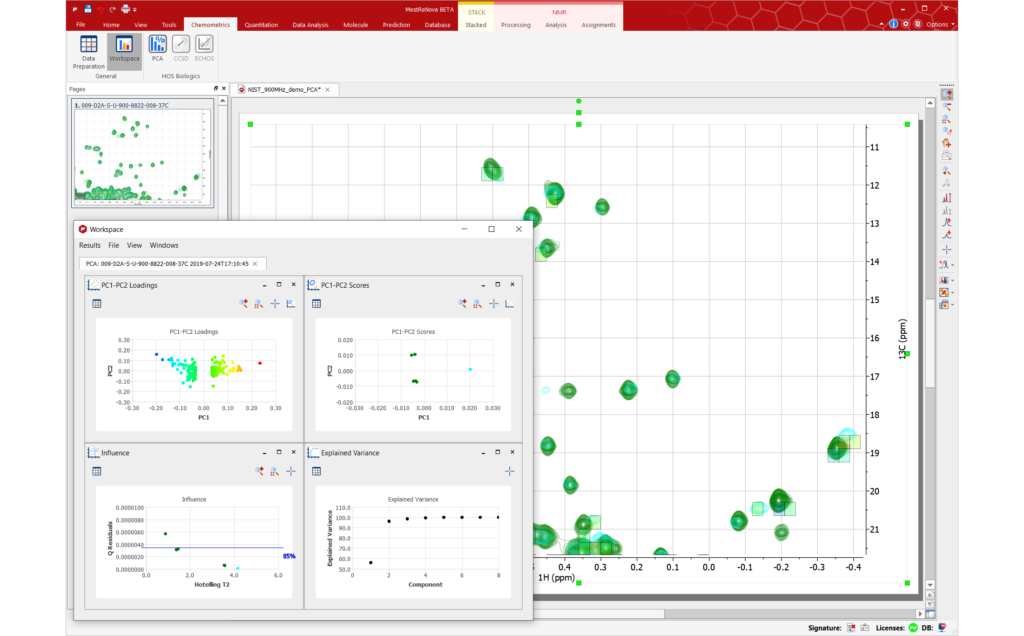
- PCA results available in interactive plots always connected to the spectra
- Explained Variance, Influence, Scores and PCA loadings plot templates available
This uses 1D NMR spectra. Small spectral changes are detected and a statistical analysis performed on evaluations.
- Typically uses 1D 1H spectra
- Small differences are quantified
- Statistically treat spectra for many spectra

Academic, Government & Industrial
Markets
MARKETS
- NMR Quality Assessment of biologic drugs
- Similarity assessment of generic biologic drugs
- Suitable for Pharmaceutical companies, CROs and academic organizations