Designed to visualize, process, analyze and report various electronic and vibrational spectroscopic techniques
Carry out the analysis of various optical spectroscopy data including ultraviolet and visible (UV/Vis), near and mid infrared (NIR/MIR), Raman, fluorescence, and other spectroscopic methods operating in the whole region of wavelength from 100 nm to 100 µm.

Multiple processing and analysis tools are available
ElViS – Electronic and Vibrational Spectroscopies
Highlights

Mnova ElViS is included in Mnova 14
Download 45-day FREE trial now!
 1. Download
Download Mnova for a suitable Operating System.
 2. Installation
Launch Mnova and navigate to ‘Help/Request Licenses‘. Choose ‘Evaluate’.
 3. License
Fill in the form to receive your trial license via e-mail.
ElViS – Electronic and Vibrational Spectroscopies
Features
To enhance the processing of electronic and vibrational spectroscopic techniques data, Mnova 15 endows the PLS based baseline correction tool (IarPLS) with a button to automatically compute a near-optimal value of its asymmetry parameter.
Additionally, three new Normalization Processing modes, i.e., Largest Peak, Integral and Vector Length have been integrated. These two key features contribute to a significant upgrade for our plugin, ElViS. The aim is to simplify the baseline correction process, streamline your workflow, and provide a rapid method for normalizing data to address quantitative issues.

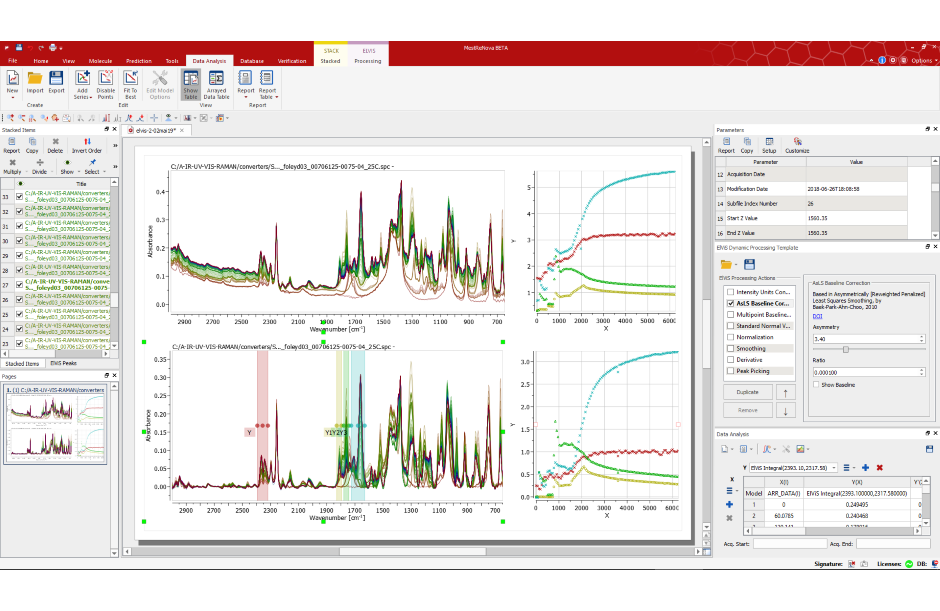
Auto Baseline Correction using IarPLS (penalized-least-squares based) Algorithm, bottom, and Show Baseline option displayed, top

Outcome of Integral type Normalization after a IarPLS-based baseline correction
Mnova ElViS supports the most frequently used data [file] formats for these analytical techniques, including import and export of single and multi-column matrix-like spectra (i.e. ASCII XY and XYY, as .txt or .csv files).
- SPC (Galactic)
- JCAMP-DX
- OPUS (Bruker)
- Single and multi spectrum SPA and SPG (Omnic)
- Perkin Elmer blocked structured (*.sp)
- ASCII (XY and XYY)
This first version of the software allows manual and automatic peak picking as well as Data Analysis of stacked/arrayed spectra.
Main Processing Features:
- Multiplicative Scatter Correction
- Probabilistic Quotient Normalization
- Baseline correction, both automatic (AsLS) and/or tailored (Multipoint Baseline Correction)
- Several Smoothing techniques such as Savitzky-Golay, Exponential, etc.
- Normalization and Standard Normal Variate (SNV)
- Derivatives
- Units conversion Absorbance to/from Transmittance

Academic, Government & Industrial
Markets & Practical Applications
MARKETS
- Pharmaceutical, chemical and food industries as well as QC environments
- Suitable for individual users or research groups, whether in large academic institutions or industry
- Ideal for teaching Optic spectroscopies in Academia
PRACTICAL APPLICATIONS
- Spectroscopic analysis of various samples, from pure substances to complex mixtures
- Analysis of spectral peaks and features, and their chemical interpretation.
- Data preparation and preprocessing for advanced multivariate analysis (chemometrics)
- Investigation and monitoring of chemical reactions and industrial processes
- Building spectral data libraries
- Professional reporting of experimental data (spectral metadata) and results
Success Stories