(Formerly Mnova MS)
Process, analyze and report your LC-MS and GC-MS data from your different instruments
Mnova MSChrom (Formerly MS) provides a common interface for different vendor data and automates all functionality such as data importing and display, integration, background subtraction, display of extracted mass chromatograms, molecule match, enumeration of molecular formulae, etc.
Effortlessly analyze and report LCMS and GCMS data from a wide range of instruments


Mnova MSChrom: 45-day FREE trial
 1. Download
Download Mnova for a suitable Operating System (below). No extra installer is required.
 2. Installation
Launch Mnova and navigate to ‘Help/Request Licenses‘. Choose ‘Evaluate’.
 3. License
Fill in the form to receive your trial license via e-mail.
Help & Resources
MSChrom
Videos
MSChrom
Highlights

Opens the power of the technique to all non-expert users.
Mnova MSChrom
Features
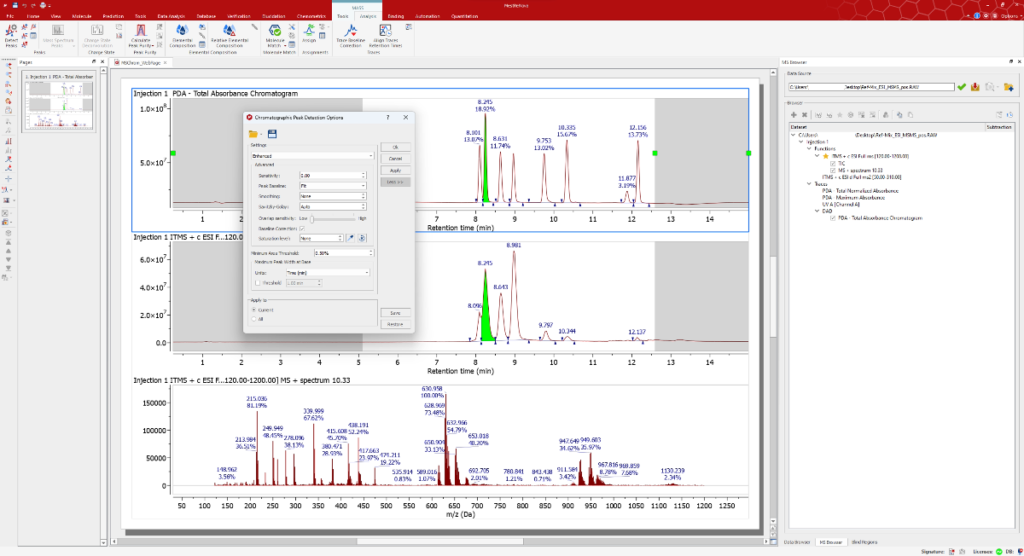
This new feature is designed to facilitate background subtraction in your datasets, offering the capability to apply mass spectra and UV subtraction to lower impurities and noisy common peaks obtained from your analytical system, etc. to achieve more precise data analysis.
Sample, 2, and blank, 1, used to apply MS Background Subtraction and the result, 3.
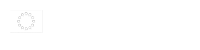
- Now, MSChrom includes a new Enhanced Peak Picking Algorithm providing an alternative to the Classic algorithm used in previous versions of MSChrom. Within Enhanced peak picking algorithm new settings are available to reproduce your best results in terms of detection and integration, including Baseline Correction, smoothing features, and a new functionality based on Saturated levels, where users can set an abundance threshold to identify those overloaded peaks due to detector saturation, and perform corrections on them.
- Introducing the new Blind Regions tool-a highly beneficial addition. This tool enables the selective exclusion of those undesired regions from chromatograms during analytical processes as peak picking or any general data treatment. Blind Regions will remain ignored saving time, resources, providing better reproducible results. It proves especially helpful in cases where challenges arise in specific regions (solvent front in LC, column bleeding in GC, etc.) or, for instance, when opting to discard the limits of the chromatogram.

Chromatographic Peak Detection Settings panel and Blind Regions table displayed after peak picking process and applying two blind regions on the chromatogram.
- Automatically open analytical data from instruments like Agilent, Bruker, JEOL, Thermo, and Waters, along with data in mzData or mzXML formats (refer to supported formats here).
- Integrate peaks in TIC, MS, and UV/ELSD traces, either automatically or manually.
- Choose mass spectra based on TIC peaks, with or without background subtraction, and display them in either centroid or profile mode.
- Manually co-add mass spectra, and seamlessly analyze and report NMR and MS data together in the same document

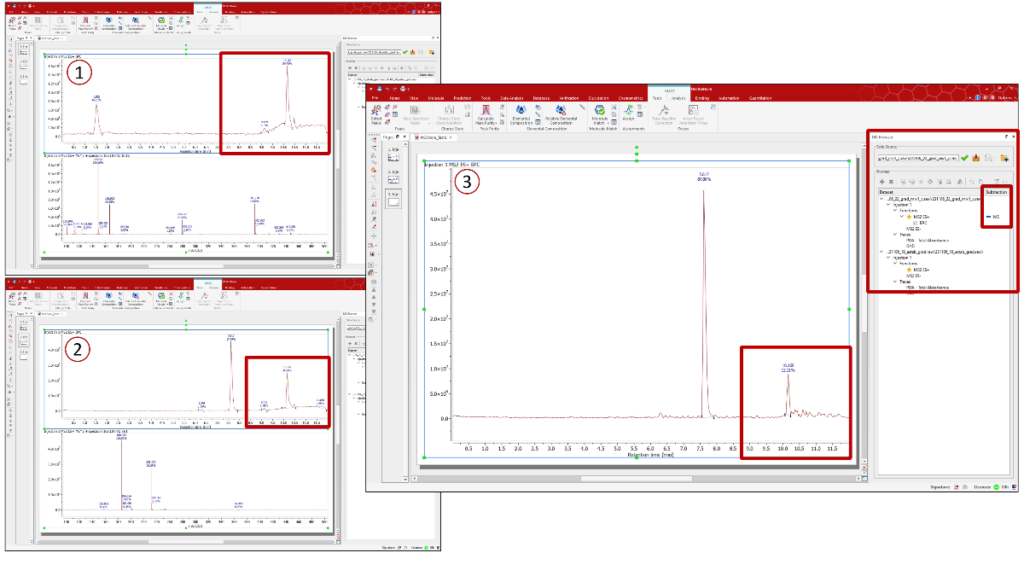
- Create Extracted Mass/Ion Chromatograms (EMC/EIC) within a specified mass range or at a particular m/z value.
- Generate UV Traces effortlessly by selecting a wavelength from a DAD trace.
- Easily extract UV spectra at chosen retention times from a PDA total absorbance chromatogram.
- Beyond its extensive NMR structure confirmation tools within the NMR plugin, Mnova MSChrom introduces the molecular match feature, an invaluable resource for verifying structures through LC/GC/MS analysis.
- This functionality is exceptionally swift and user-friendly, ensuring accessibility for all users, including those new to the field.
- Import chemical structures and let the software automatically confirm matches with your experimental data. Customize match criteria by selecting adducts, losses, mass accuracy, score thresholds, etc.

- The feature enables users to propose one or multiple molecular formulas and anticipate their mass peaks using a predefined list of adducts or losses.
- Mnova MSChrom generates a list of molecular ion and isotopic peaks, automatically aligning them with experimental peaks, if present.
- Customize the display by choosing the desired prediction, along with the corresponding adduct or loss, for comparison on the spectrum.

Mnova MSChrom users
Market
- Teaching MS and Chromatography to chemistry departments
- Research in organic, medicinal and environmental chemistry
- Quality control in chemical and pharmaceutical companies


Frequently Asked Questions
FAQs
Mnova MS supports most of the different MSChrom data formats. You can check it on the MSChrom supported format table here. Please let us know if your MSChrom data format is not in the list.
You can find the cost of this module in our online store. You can also check out for any combo option if you have or you need Mnova NMR. For any questions about pricing you can always contact us directly at sales@mestrelab.com
Yes. You can open NMR and MS data in the same document, and cut/paste the MSChrom display to the same page of NMR data if needed. Or you can create a display template to automatically format the reports.
Yes. Run Molecule Match in Mnova MSChrom to verify the elemental composition automatically, or run Mnova Verify to verify a proposed structure against your MS data (Mnova Verify needs a separate license).
Yes. Both high resolution and low resolution MS data can be used by Mnova MSChrom. Just make sure you set the proper mass tolerance parameters when you do Molecular Match.
Yes, you can download a 45-day trial license of any of our products. The Mnova MSChrom module is included within the main Mnova installer. Download Mnova and try it now!
Success Stories
Case Studies

Automated analysis and reporting LC/MS and NMR together for compound registration – A case study
A pharma company does quality control of their compounds using both NMR and LC/MS before registration, and generates the analysis reports in their own format. Based on their requirement, we developed a Mnova script (R_NMR_MS.qs) that does all of this automatically. Read More